
|
Full Charts |
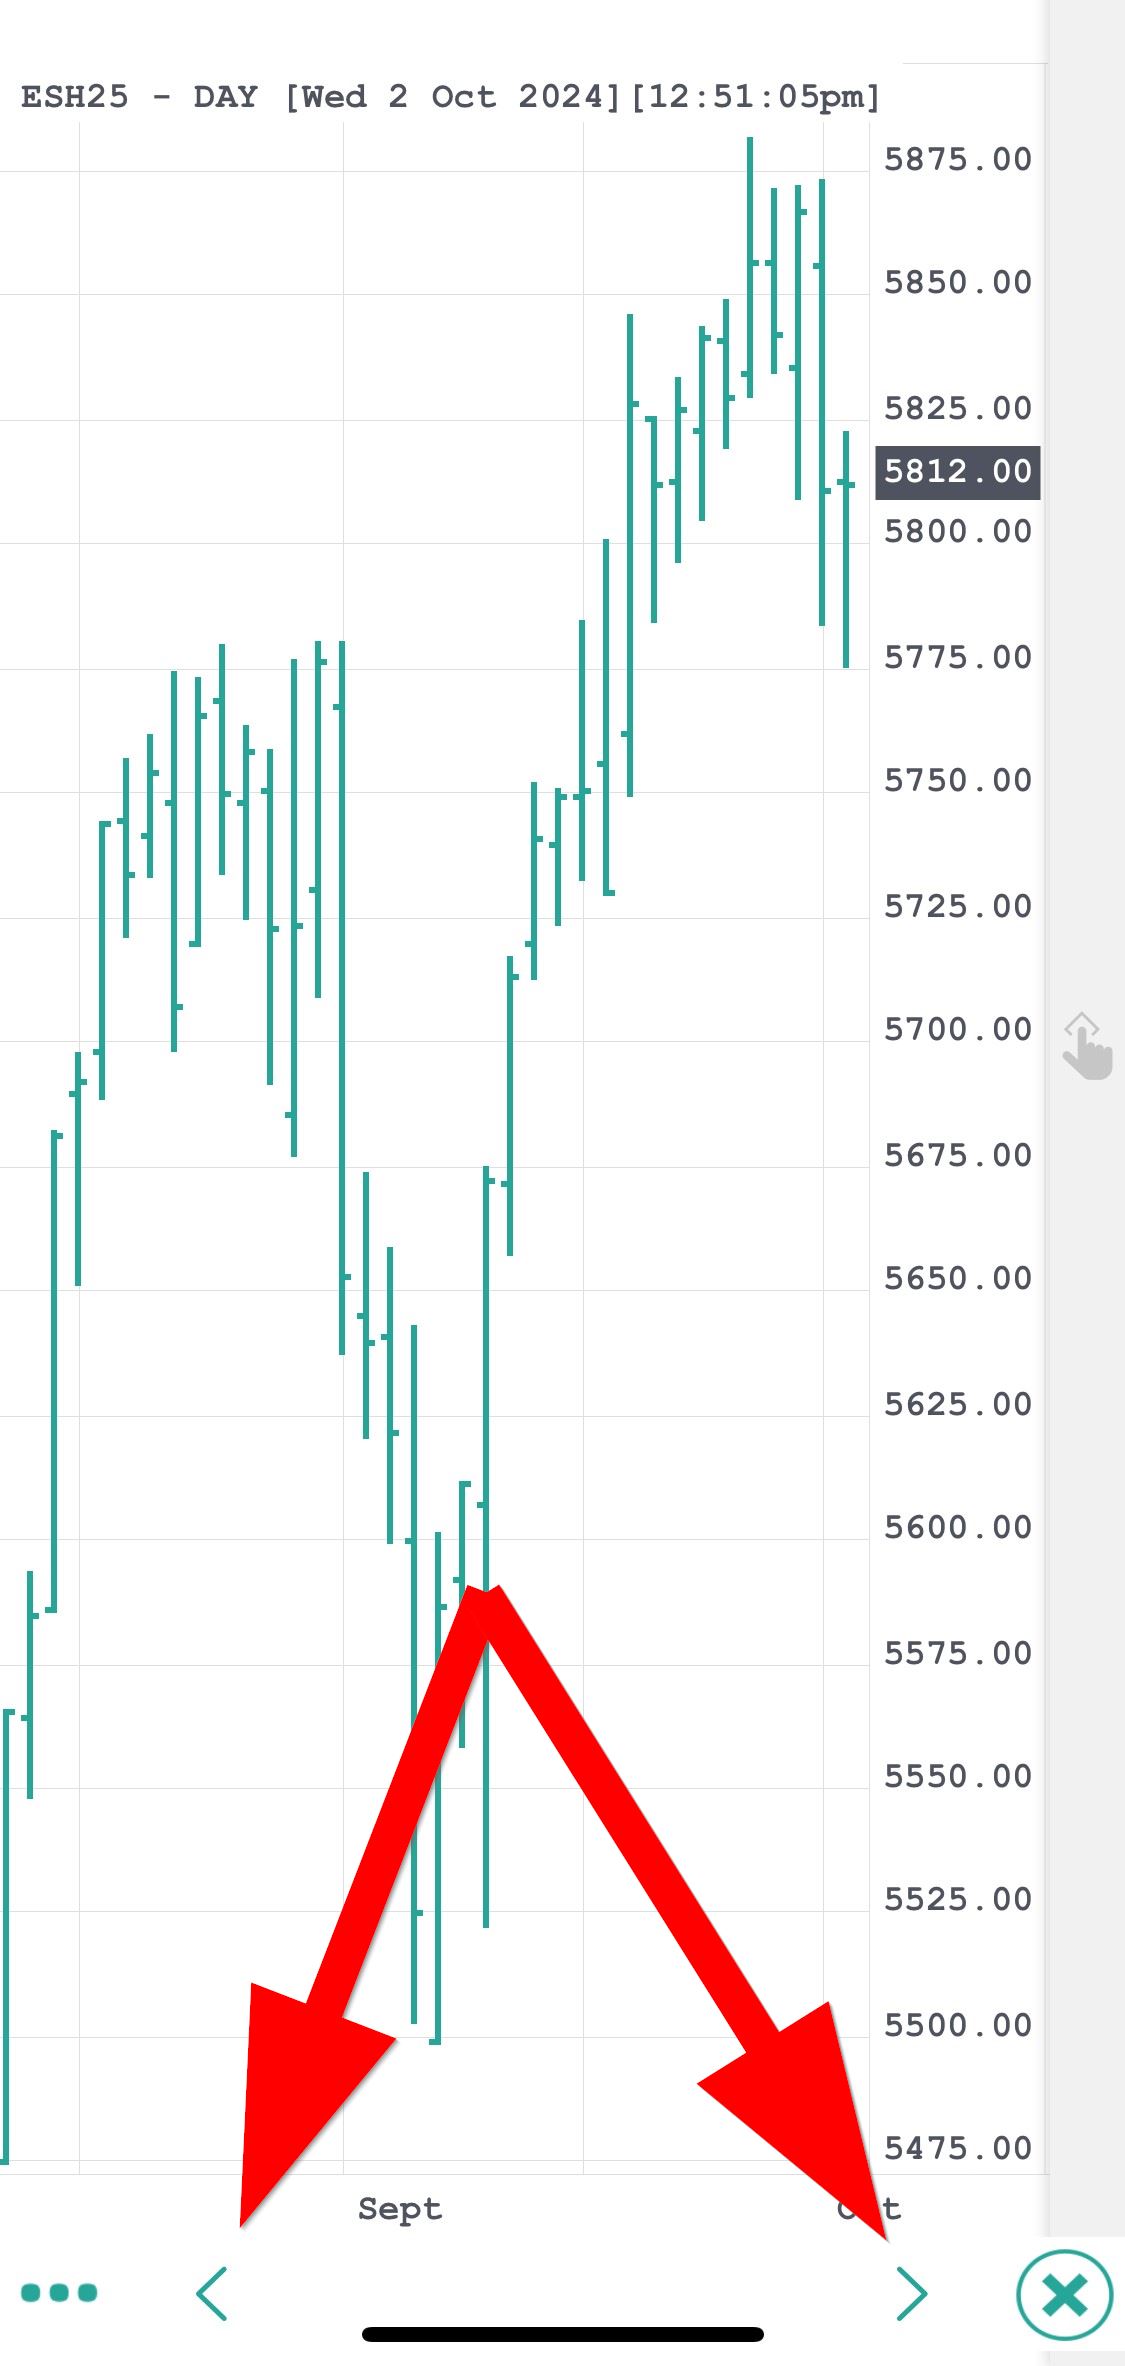
When you enter the "Charts" section for the first time, you will see a full screen chart for your currently selected instrument from the "Quote Detail" page or the long tap menu on the Quotes Monitor Page.
Tapping on the left and right arrows located on the bottom of the Chart will allow you to navigate between charts
 |
In full screen mode, you can see a menu on the lower left corner of your screen. Tap it to bring up a menu to configure your chart. |
Instrument can be changed from a drop-down list. Also can be edited at a simple tap on the instrument name.
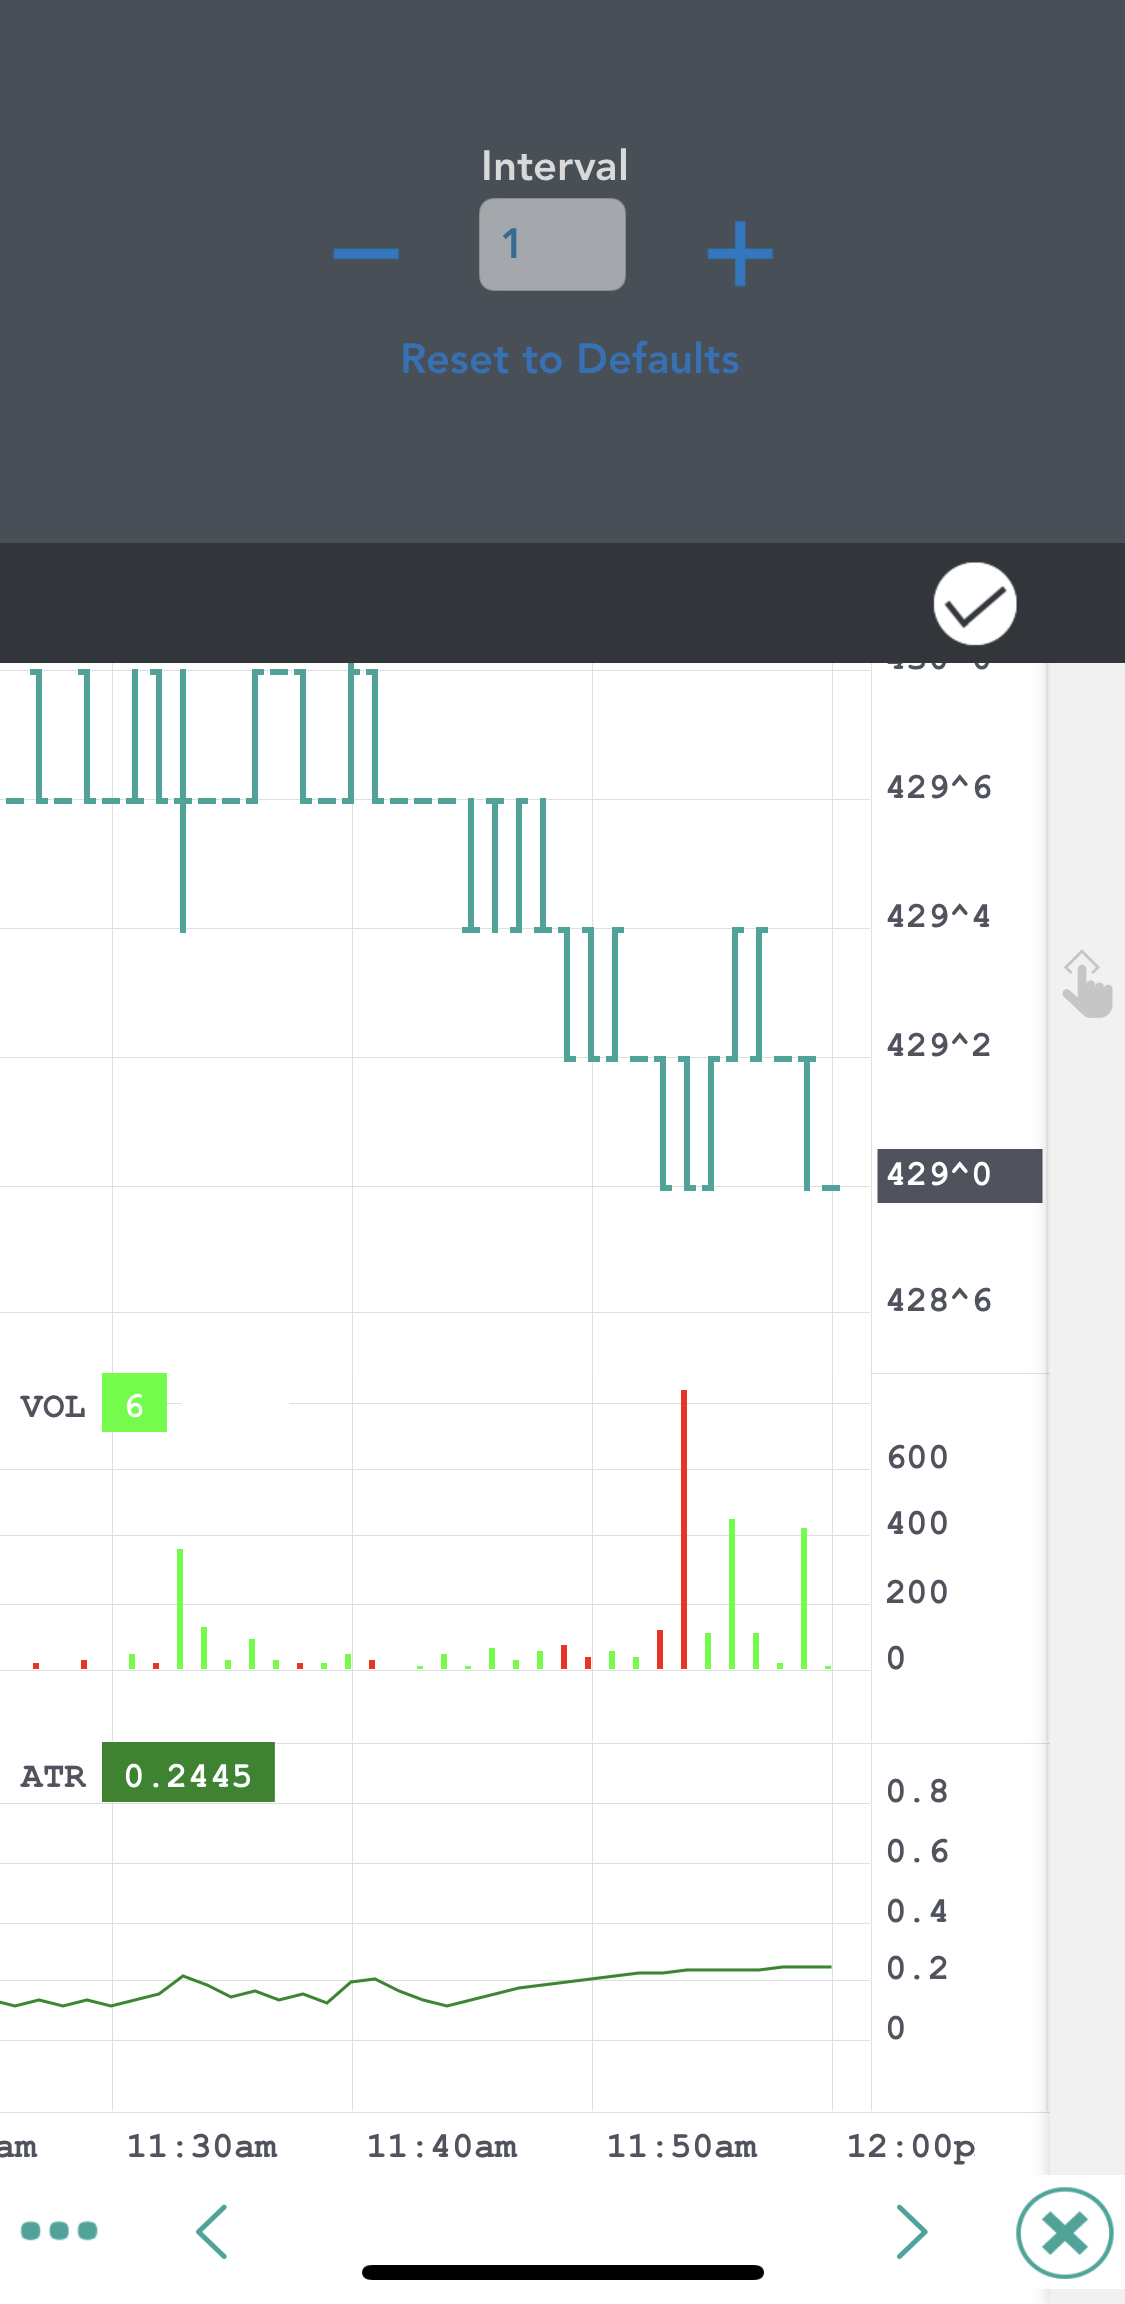
The buttons in the menu bar will let you configure the preferences for the charts. You can change the resolution of your chart, by selecting from the following list:
If you selected "tick" or "intraday", you will be also asked to select the interval for that resolution, before the chart will be refreshed.You can also edit the interval value with a custom one, add several custom values that will be saved from session to session. You can return to the default settings by pressing "Reset to Defaults."
The second section of the menu contains the Chart Type select, which lets you change the graphics of the chart to one of the following:
You can also edit the interval value with a custom one, add several custom values that will be saved from session to session. At one tap on the instrument name you can edit the symbol and load the representative chart for it.
After you are done with your configuration, tap the Done icon to go back to the chart. You can toggle the Apply to mini-chart option to apply all your settings to the mini chart from the Quote Detail page.
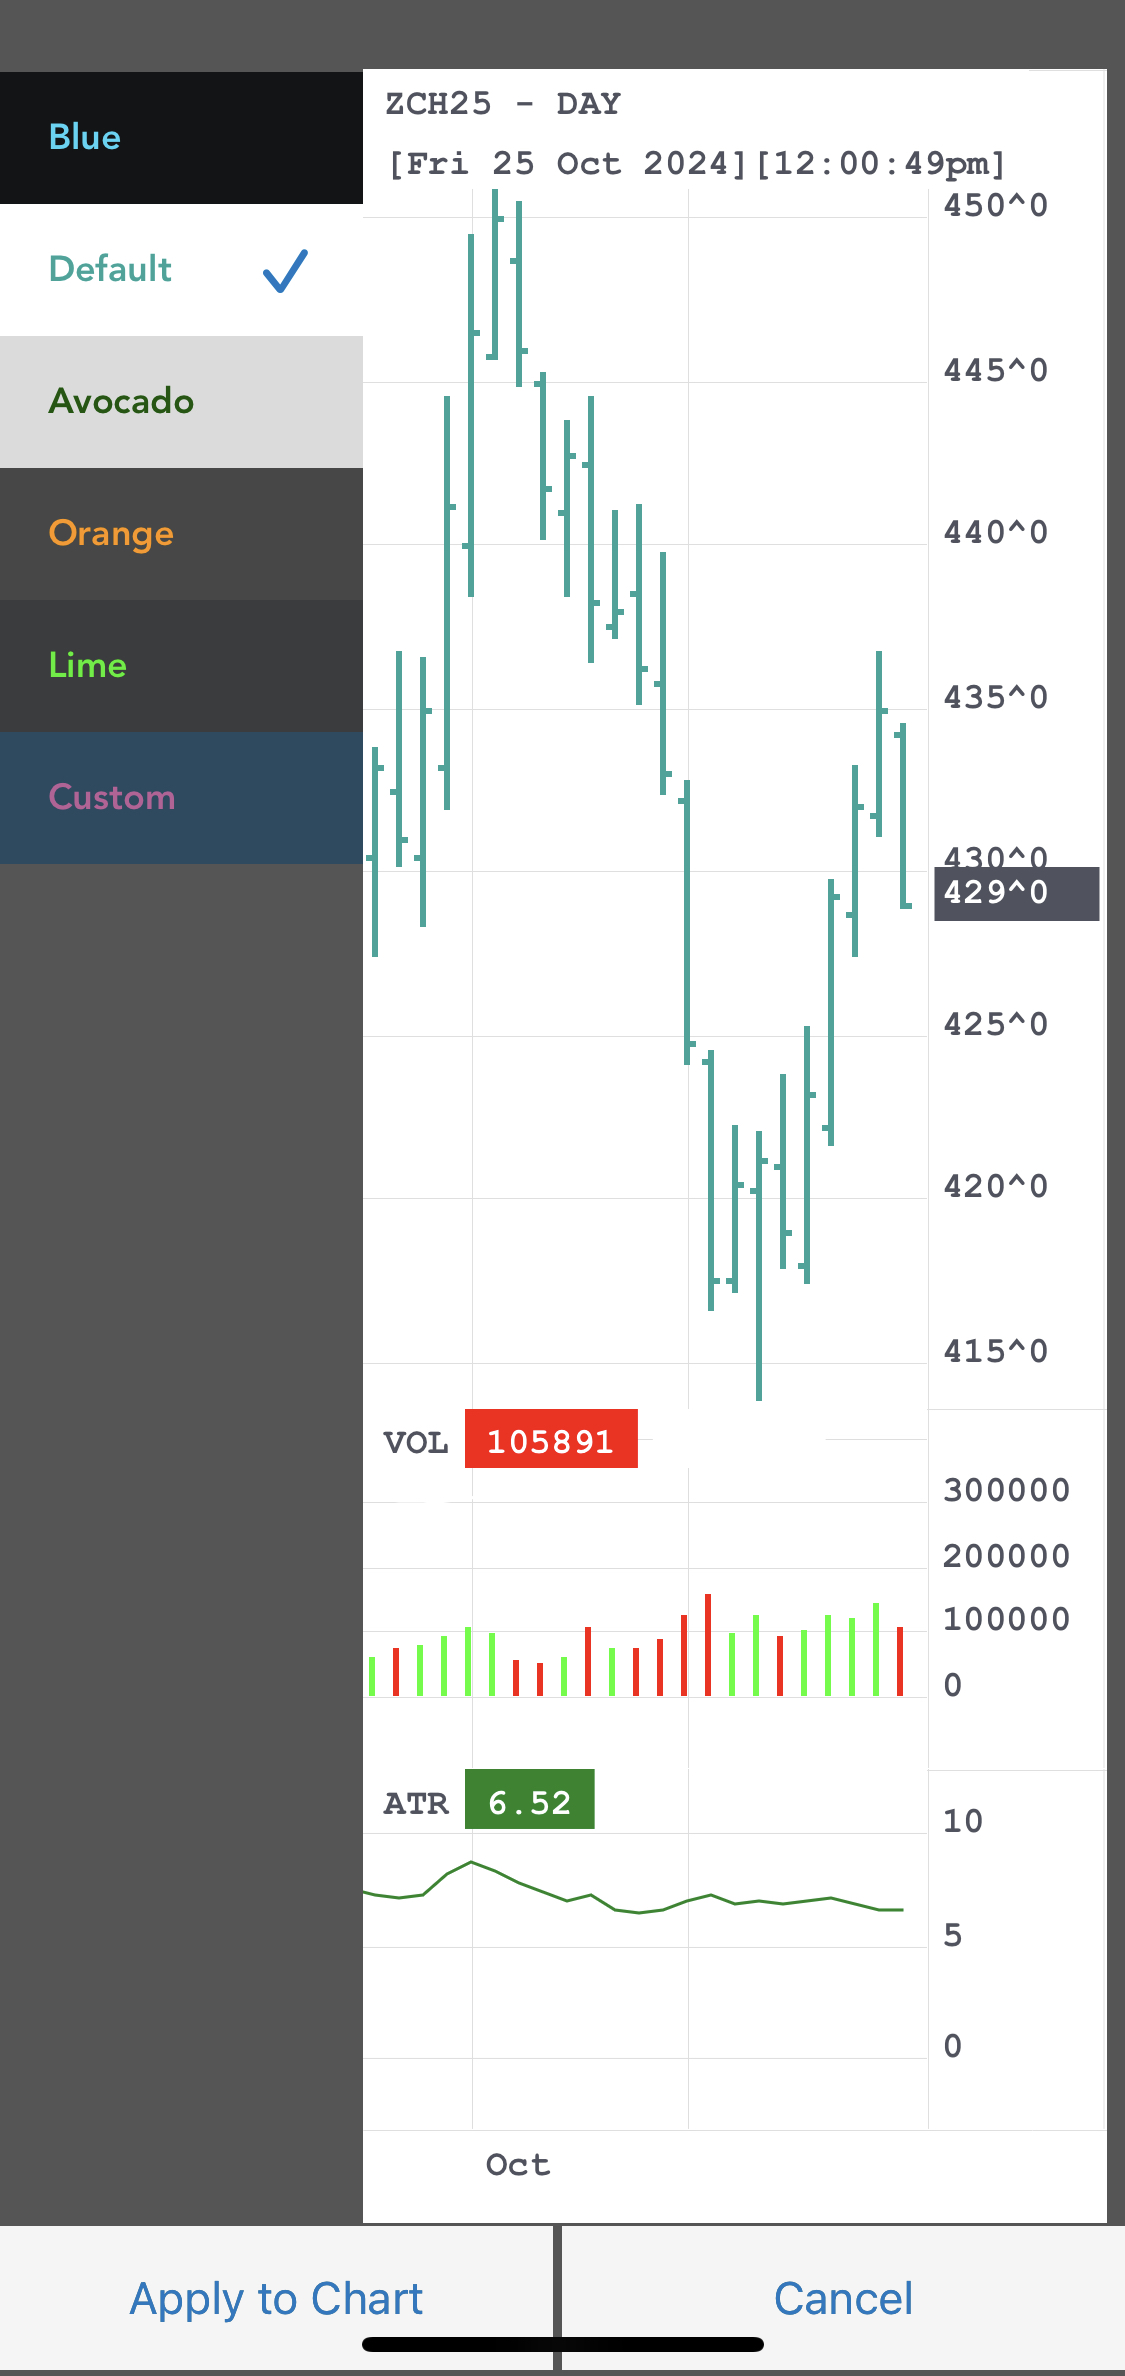
In the Chart Themes screen, you can select from a list of color themes to apply on different elements of the chart. Aside from the Default setting, you have a selection of pre-defined themes, or you can select the Custom to customize the colors for your chart. Once you have selected your desire theme, tap Apply To Chart to activate your setting and return to the chart.
The Indicators button opens the indicator settings. When you first open this screen, you will be taken to a list of available indicators. You can scroll down the list or use the Search feature to look for a specific indicator. By tapping one of them, you will add them to your active indicator list.
On the Indicators screen, you can press the + button on the upper right corner of the screen to add other indicators
You can remove indicators from the active list by tapping the red circle, then tapping the red Delete> button. You can also edit the parameters of an indicator on this page.
On the upper half of the screen there is an Enable Indicators toggle button. This must be switched On to display the indicators.
Press Back on the upper left corner of your screen when you are finished. The indicators in the list are applied on every chart. The Back button hides the menu bar, so you can see the entire chart again.
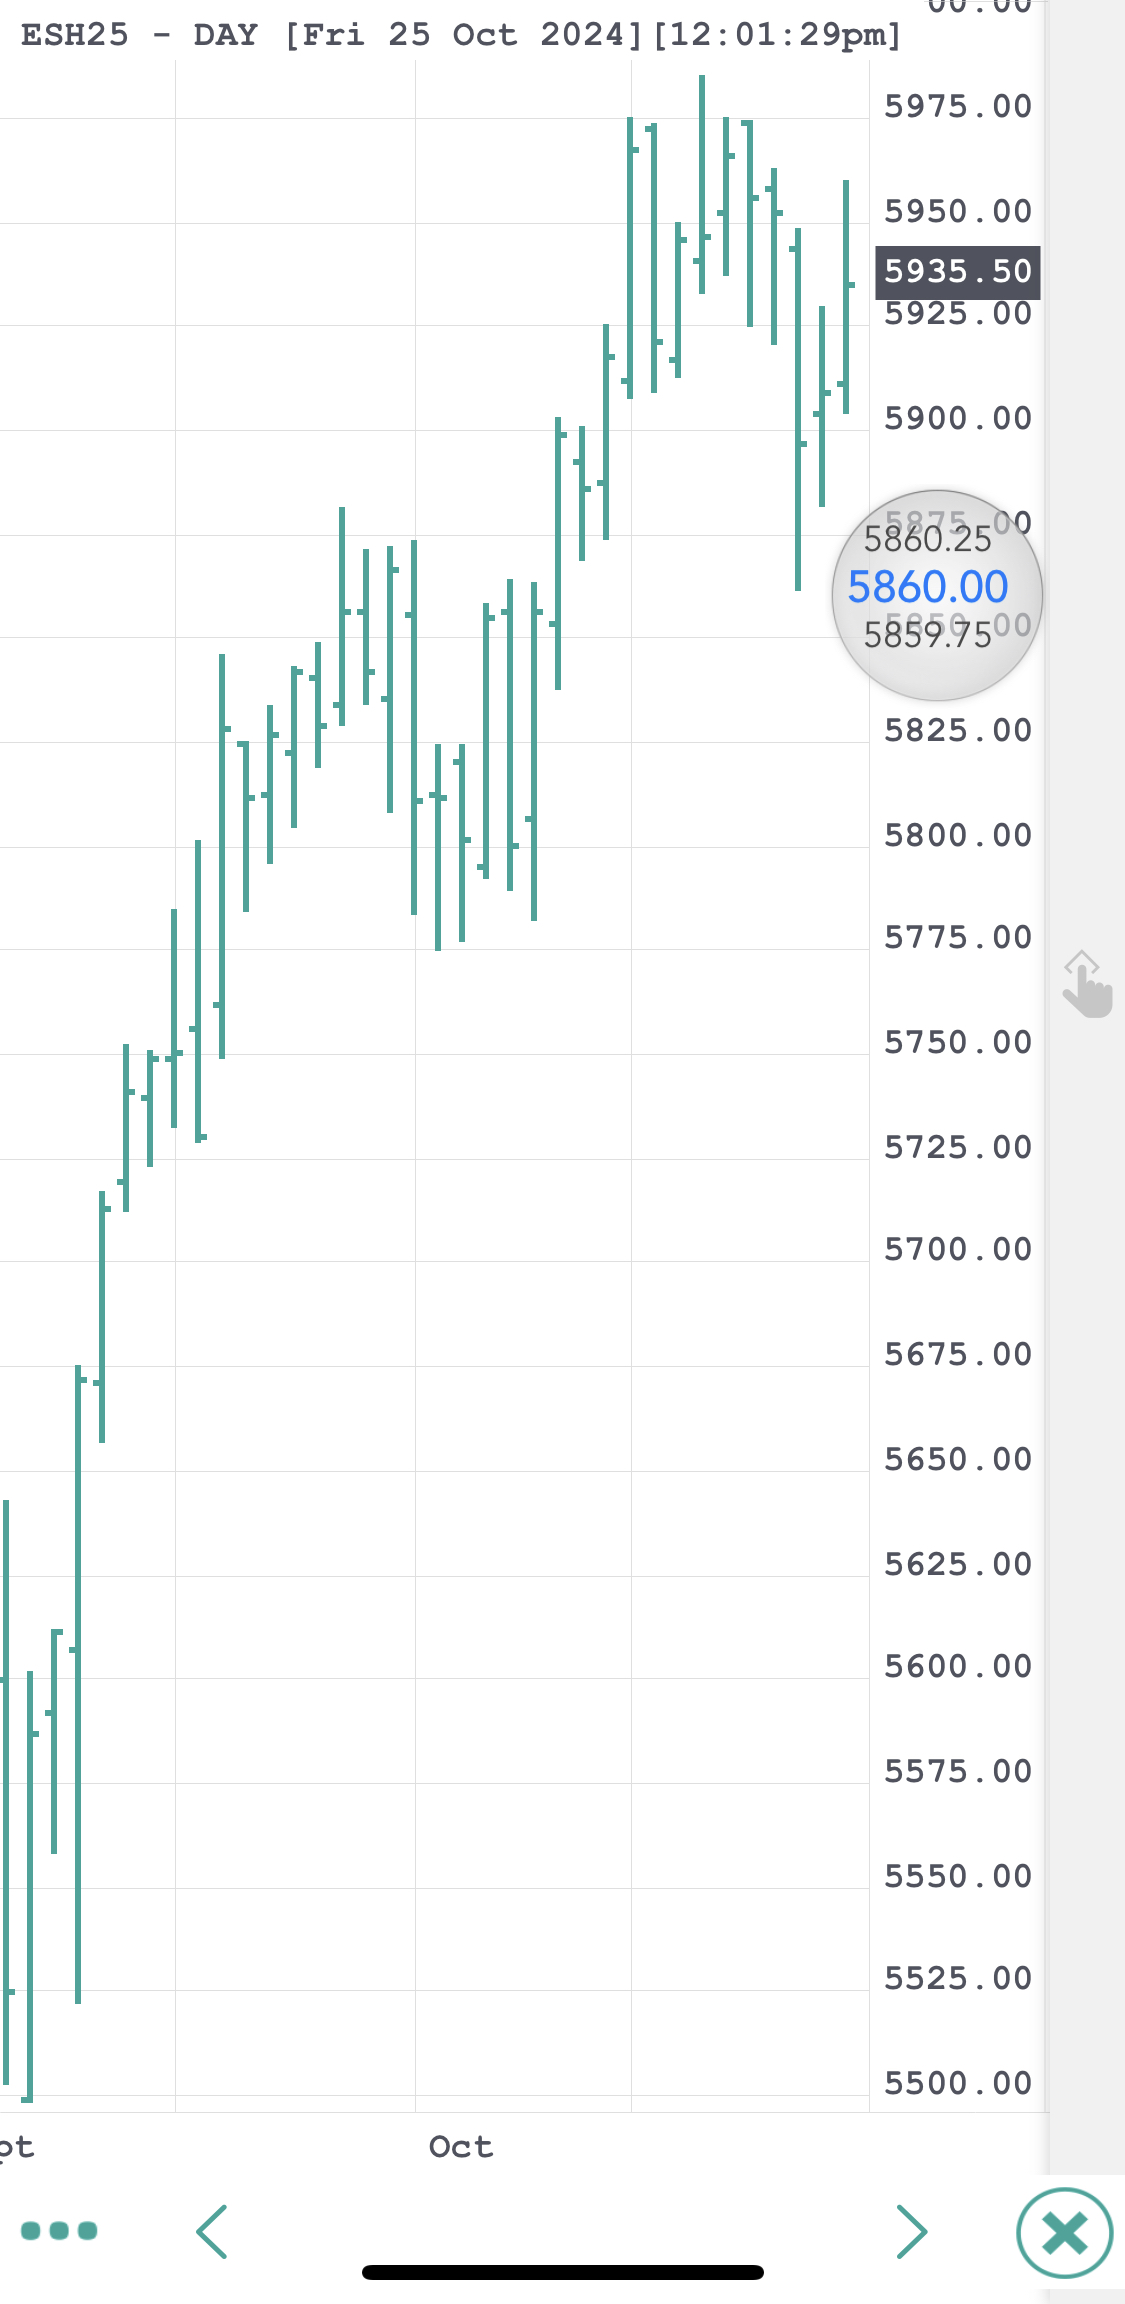
Double-tap a chart enables the crosshair cursor and the tooltip, giving you information about the High, Last, Low, First and Date of that exact point. Drag your finger on your chart to get info on a certain point on your chart. The tooltip will update accordingly. Double tap to hide the cursor and enable zooming functions.
You can zoom in and out on a chart in the same way as any other pictures on the iPhone/iPad. You can also scroll horizontally and vertically to get to specific point on the chart, even while zoomed in.
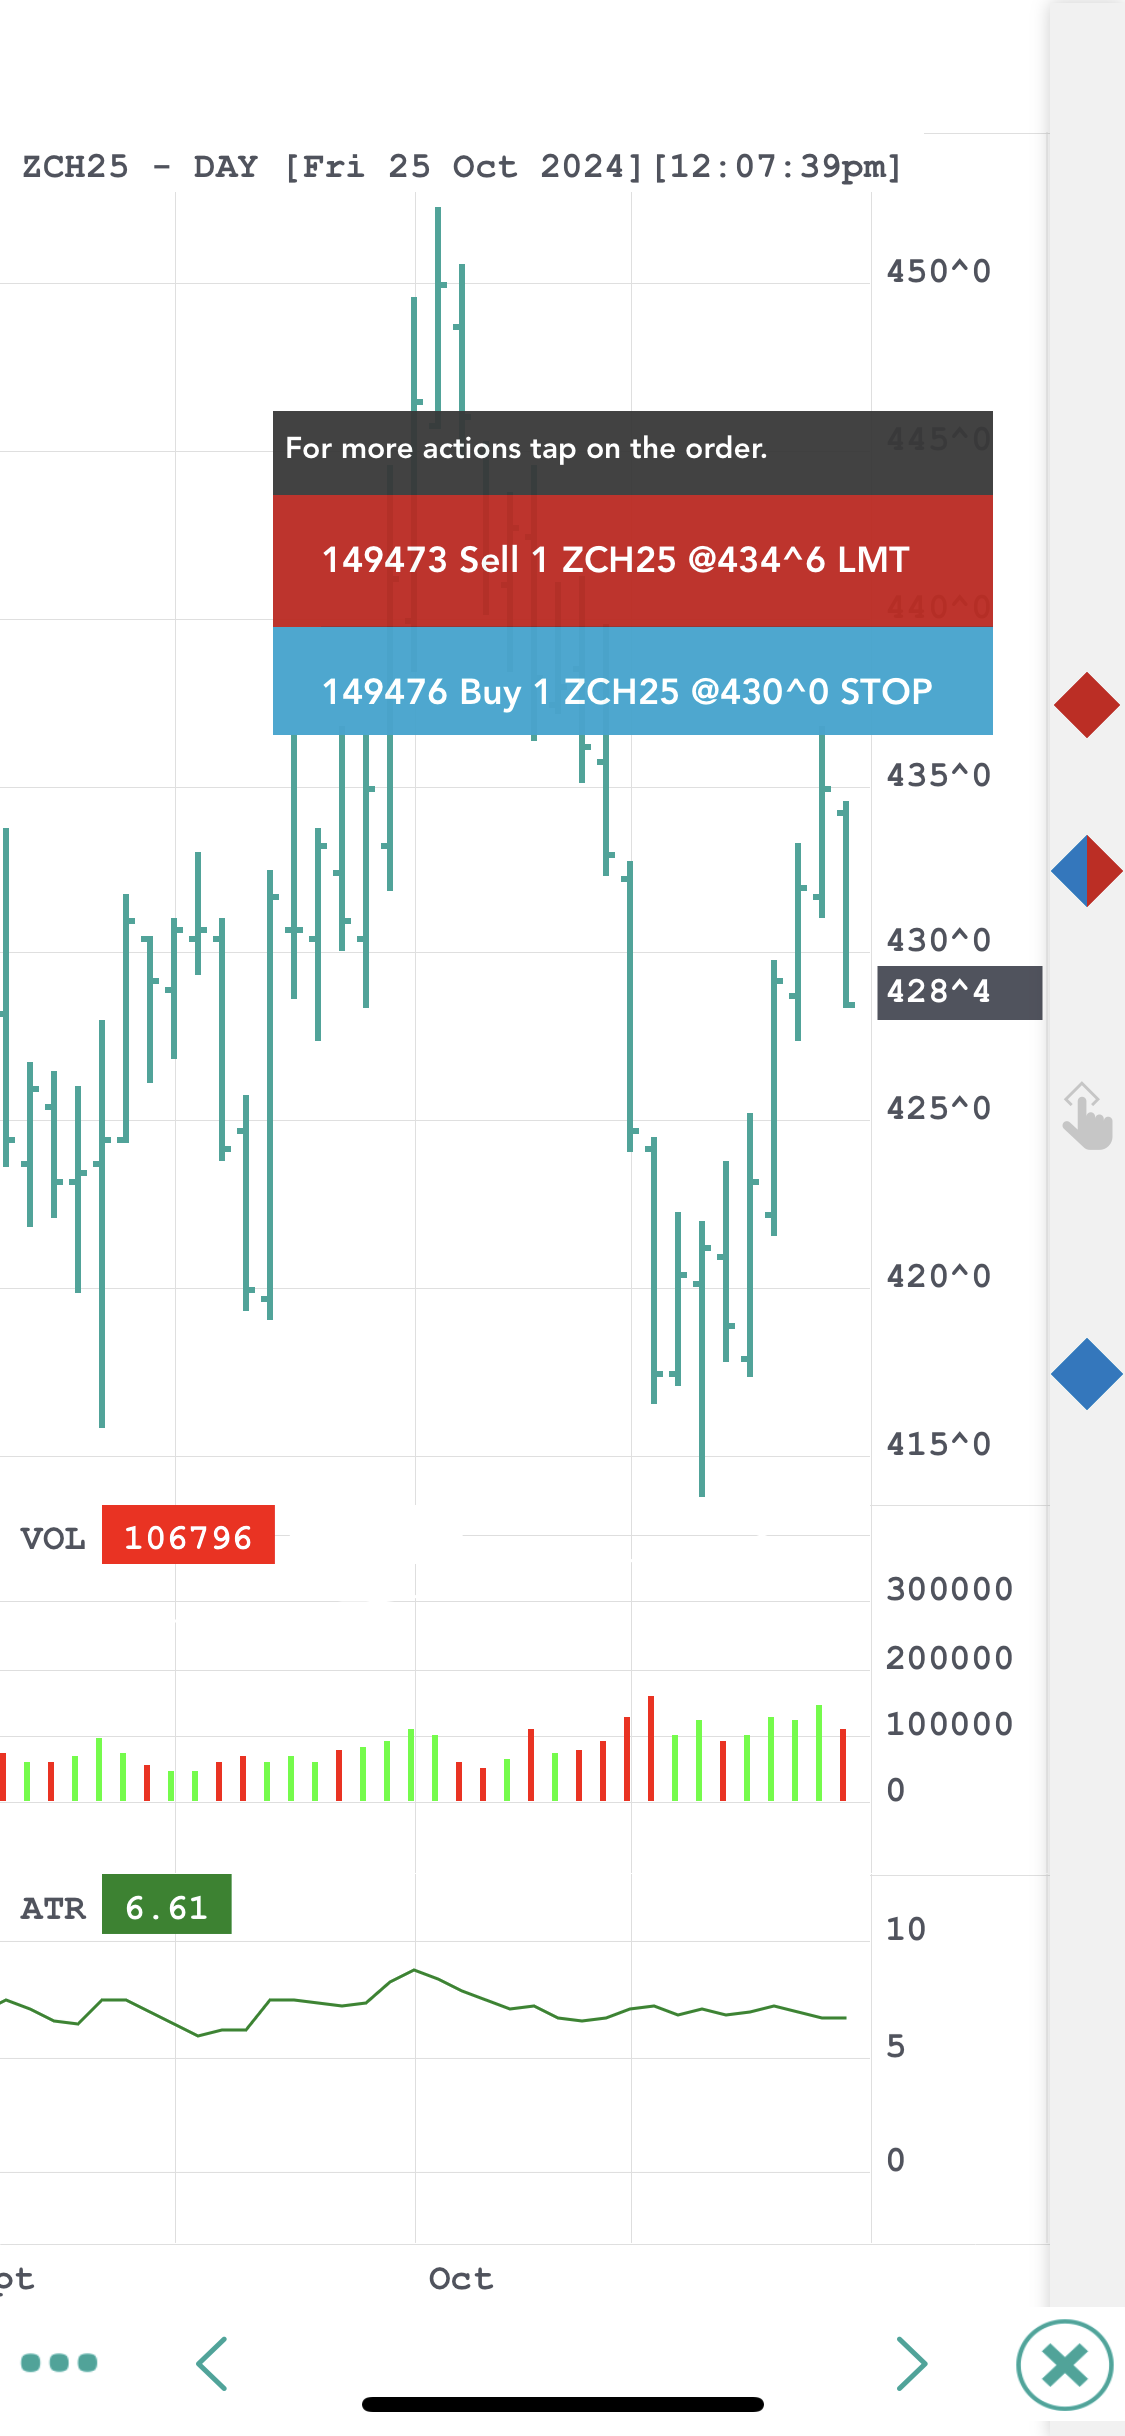
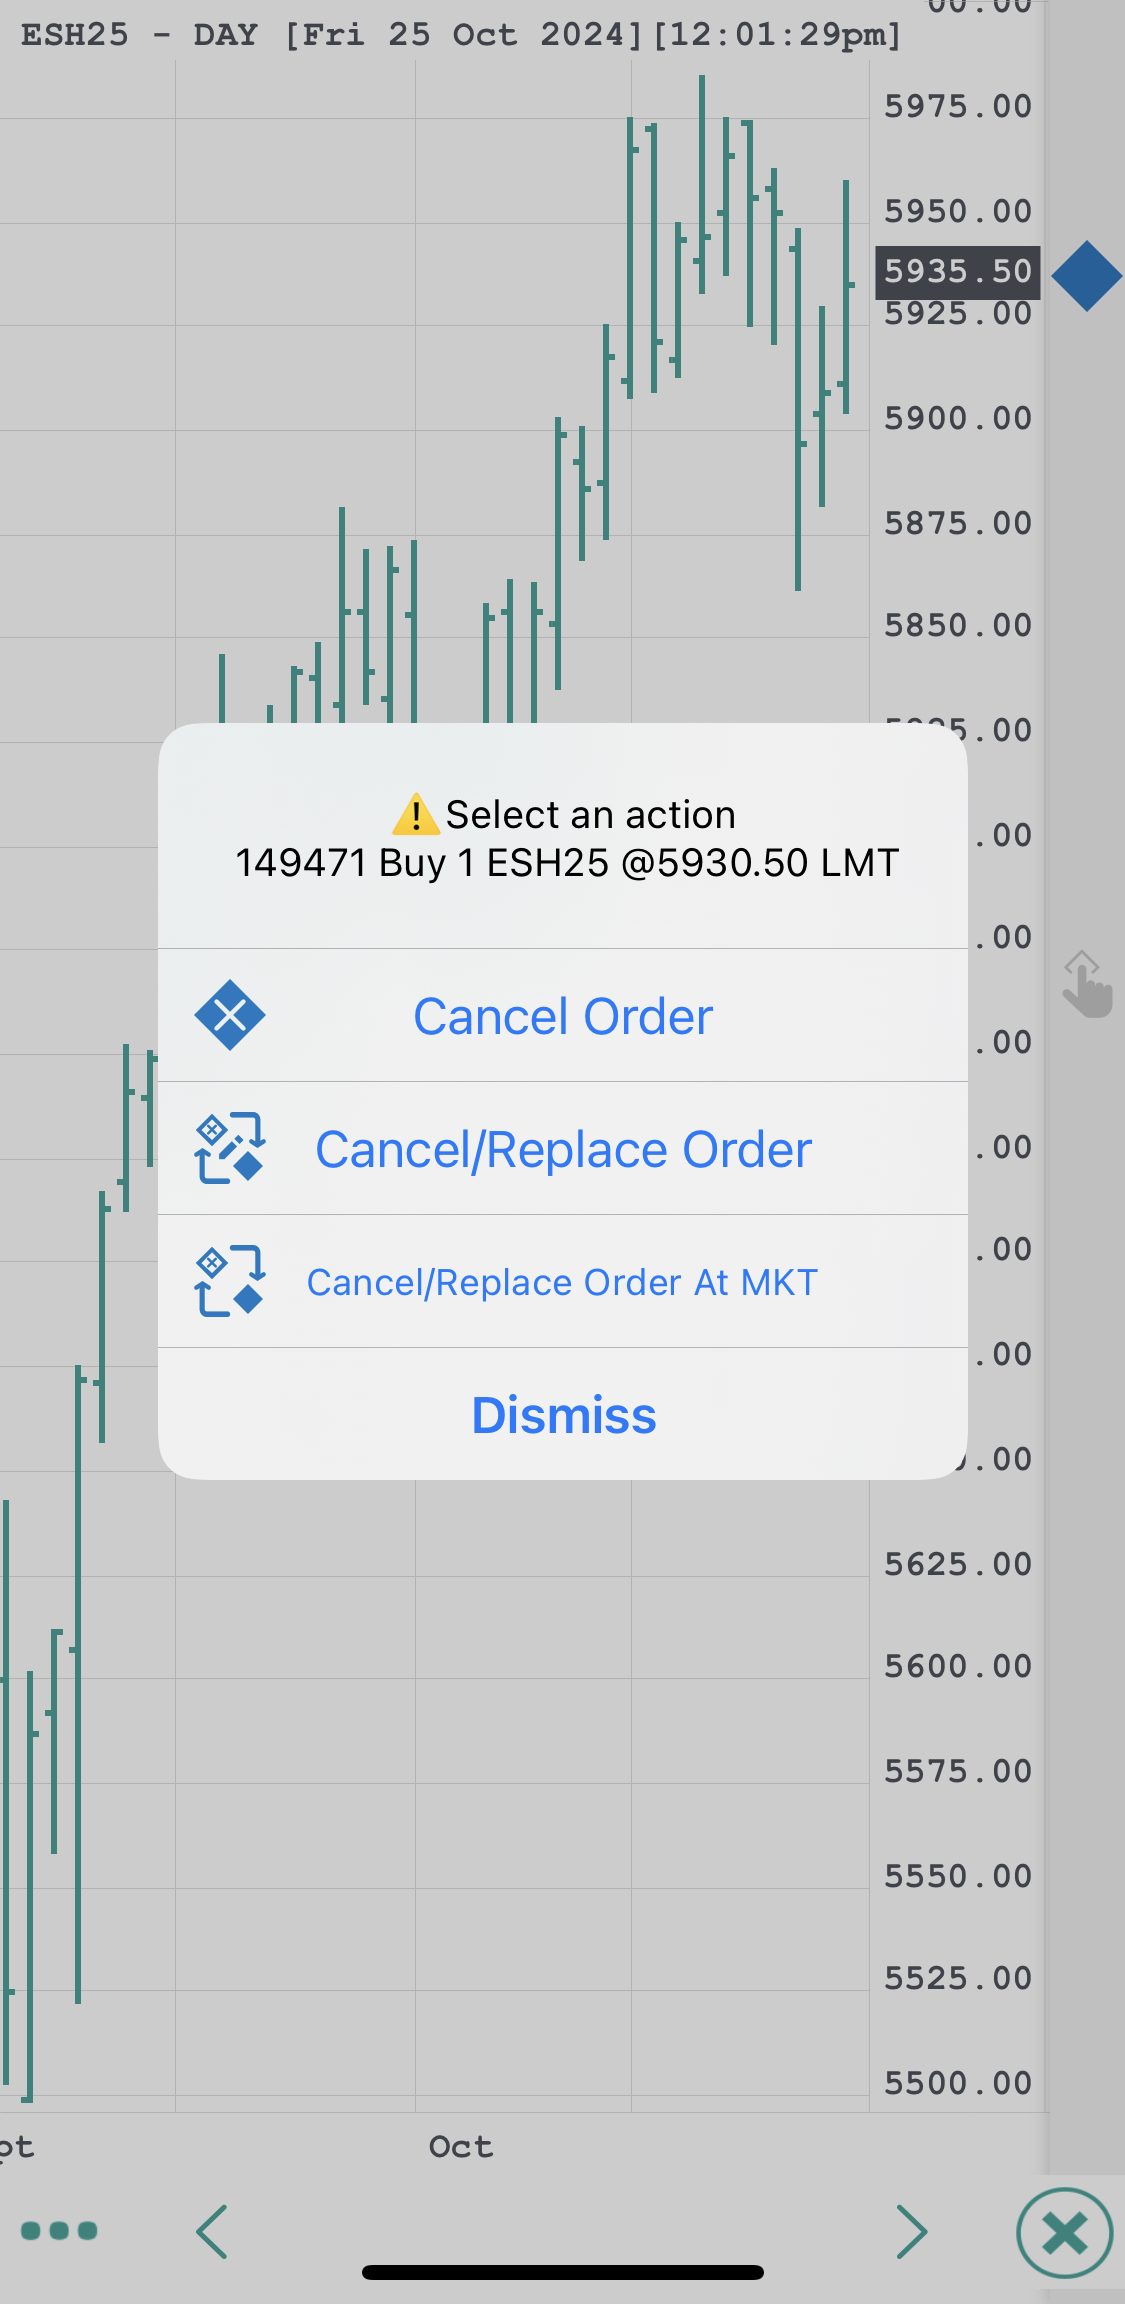
On the very right of the chart, you will find the Order Entry bar. You can tap anywhere on the bar to place a Buy or Sell order at the price right next to the bar. You will first be prompted to select Buy LMT or Sell STOP, after which you will be taken to the Order Ticket screen, where you can further customize your order before placing it. Active orders for your current instrument (regardless of where they were placed from) will appear as icons on the Order Entry bar with the following color scheme:
You can tap an order's icon to bring up the menu from there you may perform a Cancel, Cancel/Replace or Cancel/Replace at MKT on the order. To Cancel/Replace an order you can also drag the icon along the order entry bar at stop it at the price that you would like to place it at. A confirmation dialog will appear, allowing you to choose exactly which order you would like perform the action on. This is especially useful if you have multiple orders near the selected positions or even overlapped icons. Tap the info icon next to an order to go to the Order Ticket.
You can switch to a new instrument by using the same dropdown list as seen on the Page or Quote Details screen.
 |
In order to exit Charts and go to another module, press the X button on the bottom right corner of your screen. |